PLAY:double click STOP:one click The main objective of those who go for a walk is to reach the destination. Once there, they have to turn it into a new starting point and keep walking. We must celebrate results, create new goals, turn risks into opportunities, take another step with the same enthusiasm as the first, but with the confidence as the penultimate; because there is no last step for those who want to improve and move forward.
ECONOMIC OUTLOOK In the beginning of 2011, the Brazilian economy was still influenced by the strong growth of the previous year. The economy slowed down throughout the year, and 2011 closed with a Gross Domestic Product (GDP) growth of 2.7% and 6.5% inflation measured by the National Consumer Price Index (IPCA). This slowdown in growth was due to macro-prudential policies adopted by the Federal Government since the end of 2010 associated with elevation of the base interest rate by the Central Bank in the first half of 2011 in order to control an overheating economy and failure to comply with inflation targeting. Since August, with the intensification of international economic problems, especially in the Eurozone and the deceleration in domestic growth, the Central Bank initiated a new cycle of basic interest rate reduction which closed 2011 at 11.0%/year. The performance of the Brazilian economy in 2012 will be influenced by the uncertainties of the global economy. However, it will be stimulated by the macroeconomic policies adopted by the government, and especially the reduction of interest rates. In 2012, the sanitation sector will continue to generate opportunities and demanding massive investments, and COPASA plans to continue its policy of expansion and improvement of services rendered to society.
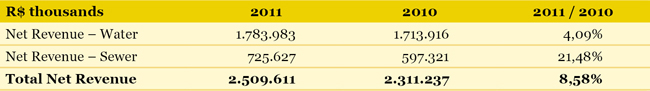
Revenues The controller’s net operating revenues for water and sewage amounted to R$2,509.6 million in 2011, an increase of 8.6% over the R$2,311.2 million reported in 2010. This increase can be explained by the service increase, due to COPASA’s effort to increase service coverage in the State of Minas Gerais; due to the 7.02% rate increase approved by the Regulatory Agency, whose full impact was felt since late May 2011; and due to the sewer rate collection percentage changes, because Sewage Treatment Plants (ETEs) started their operations in several cities throughout the year. Following is a comparative table of water and sewer net operating revenue in 2011 and 2010:
As can be seen, the evolution of water and sewer revenue happened differently in the period being analyzed. The increase in sewer rate percentage billing from 40% to 45% of the water rate happens when sewer is only collected, and increase from 60% to 75% when the sewage is treated. Offset by a reduction in the water rate, it resulted in a significant sewer revenue growth compared to that obtained with water services.
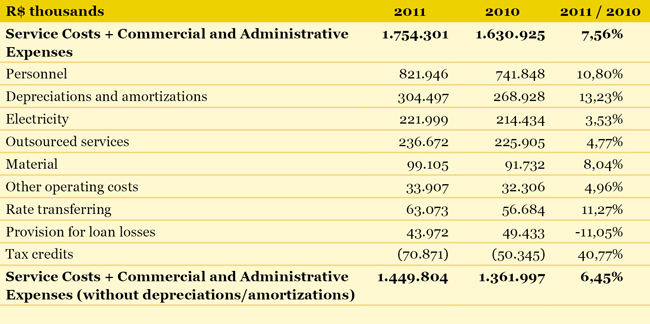
The items that most contributed to COPASA’s costs increase in 2011 compared with 2010 were:
On the other hand, there was a reduction in Item Provision for Loan Losses, due to a change in 2010, in the manner of accounting for interest and monetary adjustment of delinquent customers’ bills. In addition, there was a 40.8% increase in tax credits due to the incorporation of capital assets and completion of jobs since December 2010, which were depreciated/amortized as of January 2011.
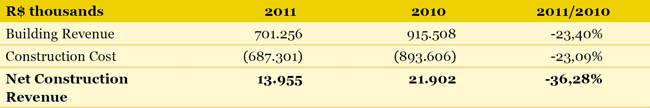
Given that construction net revenue results have no effect on cash, the Company does not include it in the EBITDA calculation, because it believes that this figure represents only an economic gain. However, its accounting has implications in the year that is recognized, since its net income is part of the calculation basis for the payment of interest on personal capital/dividends, and in employee profit participation. Following is a comparative table of building revenue in the last two years:
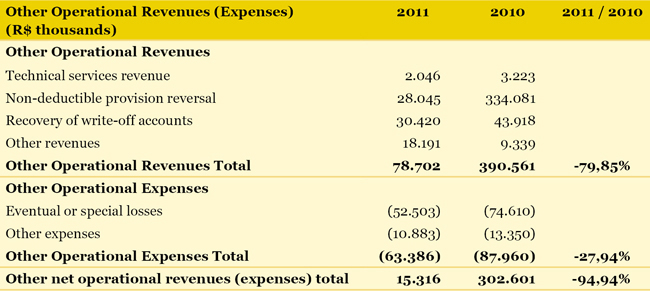
Other Operational Revenues (Expenses)
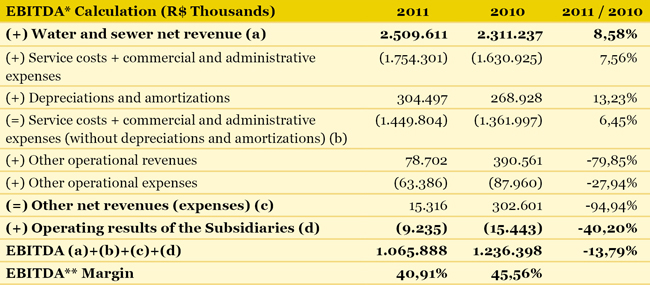
Company’s Operating Results Regarding operating results, in 2011COPASA presented an 8.6% increase in water and sewer revenues, while service costs added to the commercial and administrative expenses (excluding depreciation and amortization) increased by 6 5%. In the same comparative period, other net operational revenues (expenses) decreased by 94.9% due to the extraordinary provision reversal of the net actuarial liability in 2010. This reversal affects the EBITDA comparison of 2011 with the previous year.
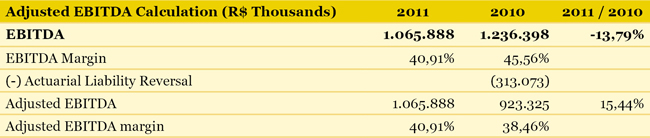
*The Company does not consider construction revenues (costs) in the EBITDA calculation, considering that this net result has no effect on cash and represents only an economic gain. However, if we disregard the extraordinary provision reversal of the net actuarial liability in 2010, the adjusted EBITDA would be:
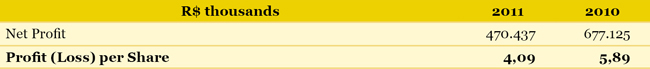
Net Income and Profitability
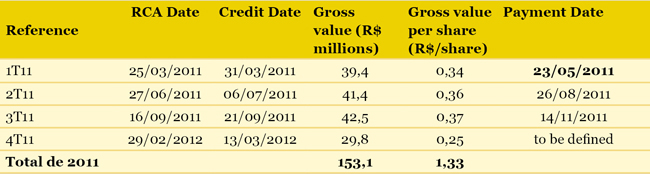
Shareholder returns Such distributions have happened according to JCP, ad referendum of the Ordinary General Meeting, as provided in its bylaws. At the Shareholders General Meeting distributions are ratified for the year. In following table shows the JCP statements for 2011.
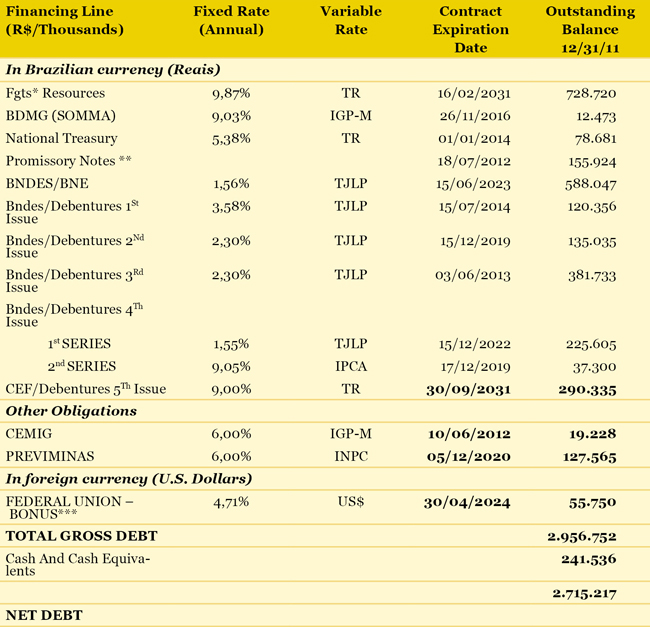
The Board of Directors has approved maintaining the distribution of JCP dividends for 2012 at 35% of the net income, adjusted according to Article 202 of Legislation 6404/76. The Administration Board will be responsible for the defining the percentage to be distributed to shareholders until the end of the first quarter of each financial year, as defined in the Dividend Policy. This definition will take place after evaluating the Company’s results, its investment prospects and the performance of the Market Expansion Program. This proposed percentage will be at most 50% of the net income, with quarterly distributions and payments within 60 days after distribution. Debt The short-term debt at end of the fiscal year was R$575.0 million, and the Company had R$241.5 million in cash and short-term investments. Moreover, R$70.0 million of this debt is related to the convertible debentures whose conversion option may be exercised by the BNDESup to the end of May 2012. The net debt amounted to R$2.71 billion, and the Net Debt/EBITDA ratio was 2.5. The following table lists the balances and main features of financings in December 31st, 2011:
* FGTS (Fundo de Garantia do Tempo de Serviço) [Dismissal Compensation Fund] Resources: CEF (Caixa Econômica Federal), Bradesco, Itaú and Unibanco. The average interest rates of these loans and financings was 8.7%/year on December 31st, 2010, and some financing lines also exhibit their outstanding balances tied to specific indexes, such as: FGTS, National Treasury and CEF (Caixa Econômica Federal) 5th Issue (TR),BDMG Somma and CEMIG (IGP), BNDES 2nd series of the 4th Issue (IPCA), PREVIMINAS (INPC) and the Federal Government (U.S. dollars). Financings Negotiated in 2011 Caixa Econômica Federal:
The deadline for debt repayment is 240 months, with a 44-month grace period. Financial cost is 7.3% per year, added to the Referential Interest Rate (TR).
The deadline for debt repayment is 240 months, with a 38-month grace period. Financial cost is 7.3% per year, added to the Referential Interest Rate (TR).
The deadline for debt repayment is 240 months, with a 36-month grace period. Financial cost is 7.3% per year, added to the Referential Interest Rate (TR).
On December 31st, 2011, COPASA had contracted loans from Banco Nacional do Desenvolvimento (BNDES) and Caixa Econômica Federal in the amount of R$1.07 billion, to be disbursed and accounted for as they are used, as well as resources originating from KfW contracts. These funds will be used in the Company’s Investment Program.
Investments Investments in 2011 totaled R$682.9 million. Of this total, R$270.5 million was invested in water supply systems, R$390.6 million went to collection and sewage treatment systems, and the remaining R$21.8 million was invested in development programs, general goods and others.
Besides its own resources, the main sources of funds used to make the investments were loans from Caixa Econômica Federal and BNDES. Work at the Rio das Velhas Production System was concluded, which resulted in increased water production capacity. Work at the Blue Line was also completed, which connects the Rio das Velhas Producer System to the Paraopeba System, in order to ensure water supply to the Belo Horizonte Metropolitan Region (RMBH) population. In addition to these investments in the metropolitan integrated production system, other investments are highlighted for the expansion of service capacity of water supply systems in several cities, such as: Itamarandiba, Jaíba, Santa Bárbara and Teófilo Otoni. Investment in sanitary sewage systems refers mainly to those of decontamination of the for the Rio das Velhas Basin and the establishment of the sanitary sewage systems of Esmeraldas, Jaboticatubas and Jequitinhonha; the ongoing construction projects of the Sewage Treatment Plants (ETEs) in Pará de Minas, Patos de Minas, Santo Antonio do Monte and Teófilo Otoni; the expansion of the sanitary sewerage systems of Esmeraldas, Pouso Alegre, Ribeirão das Neves, Santa Luzia, and Santa Rita do Sapucaí.
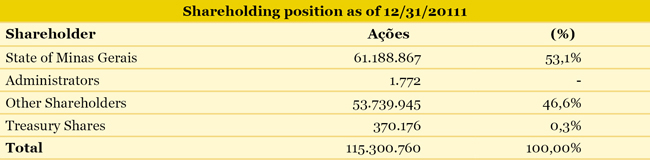
CAPITAL MARKET Corporate structure and Stock Performance COPASA is listed on BOVESPA’s New Market under the CSMG3 ticker, with shares traded since February 2006. Its capital stock is R$2.64 billion represented by 115,300,760 shares, of which 53.1% belong to the state of Minas Gerais, 46.6% are in circulation (free float) and the remaining 0.32% is held in treasury, as shown below:
The Company also has 1,096,047 convertible debentures in 4,384,188 shares. 50% of them have a conversion deadline of May 31st, 2012, and the remainder is due on May 31st, 2013. If the debenture holders opt for conversion, the number of Company shares will rise to 119,684,948 and the share capital will be lower than the minimum authorized of R$3.0 billion. In this case, the controlling shareholder would represent 51.1% of the Company’s capital. The performance of the share price, adjusted for interest on capital/dividends, showed an increase of 23.3% in 2011, and in the same period, the Ibovespa index dropped 18.1%. On December 31st, 2011, the unit price of the shares was R$33.40, and the Company’s market value amounted to R$3.84 billion. The comparative chart below shows COPASA’s stock performance compared to Ibovespa:
Another important point is the increase of COPASA’s share liquidity in 2011, compared to the previous year. The average daily trading volume was R$7.1 million, with an average of 1,151 trades per day, being present in 100% of the sessions. Its base was formed by about 2,500 shareholders in 37 countries. To promote the liquidity of its shares, the Company counts with the BTG Pactual to act as market maker. COPASA’s shares represent an important part of the BM&FBOVESPA indexes, such as the IBrX-Brasil index (which lists the 100 most liquid shares of the stock market); the Índice de ações com Tag Along Diferenciado [Differentiated Tag Along Index Shares] (ITAG); the Corporate Governance Differential Index (IGC); the Small Caps Index (SMLL); and the Corporate Trade Governance Index (IGCT). Moreover, COPASA was selected to integrate the theoretical portfolio of the Corporate Sustainability Index (ISE BM&FBOVESPA) again in 2012. The portfolio brings together companies that have a strong commitment to sustainability and environmental responsibility.
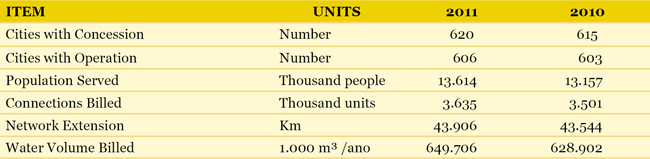
COMMERCIAL AND OPERATIONAL PERFORMANCE Service Data The population who received water supply by the Company (including the Controller and COPANOR) increased by 457 thousand people, an increase of 3.5%, reaching about 13.6 million people at the end of 2011. This performance resulted from an increase of 134 thousand new water connections from the Controller and COPANOR. COPASA – Consolidated 1 WATER SUPPLY SERVICE
¹ Consolidated data (includes locations operated by the subsidiary COPANOR). (GRI 2.7)With respect to sewage systems, the expansion was even greater as a result of efforts made to increase service coverage. The number of cities served increased from 159 in 2010 to 176 in 2011, benefiting a total population of 8.3 million, an increase of 516 thousand of people served. This service is performed through 2.1 million sewage connections, an increase of 156 thousand connections (8.0%) compared to 2010. Of these, about 81 thousand refer to the beginning of operation and invoicing of new locations. The collection system expanded 1,791 km, totaling over 18.1 thousand km. COPASA
(GRI 2.7) There was a breakthrough volume of sewage treated by the Company, which reached 182.2 billion liters, an increase of 16.0% over the previous year, due to start-up of eight new Sewage Treatment Plants (ETEs) in cities throughout the State of Minas Gerais, among which are: Araçuaí, Curvelo (San Antonio) and Itajubá (Sapucaí).
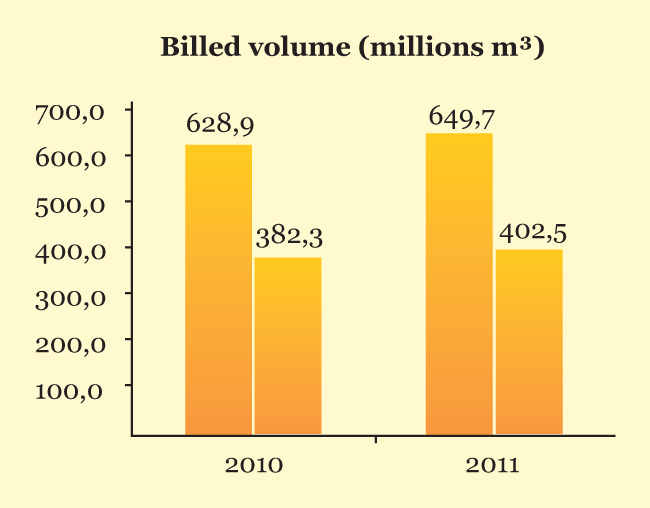
In 2011, the Company’s expansion increased the volume of billed water at 20.8 billion liters (3.3%) and the volume of billed sewer at 20.3 billion liters (5.3%). The expansion of water supply and sanitation sewage services in locations that were already being served, and beginning of sewer systems billings in new locations such as Cataguases, Pedra Azul, Perdões, São Sebastião do Paraíso, and Sarzedo and contributed significantly to this growth.
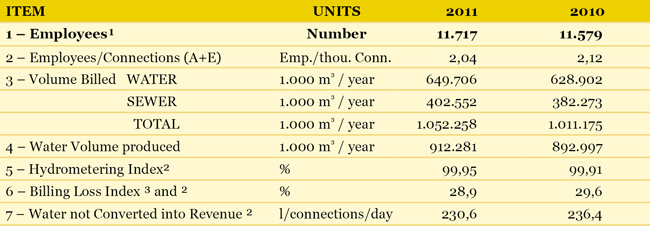
Personnel productivity results – measured by the ratio employees/1,000 connections (water + sewage), rose from 2.12 employees/1,000 connections in 2010 to 2.04 in 2011, mainly due to the increase of sewage connections. The following table represents the performance of some operational/commercial indicators for the indicated period: COPASA – Consolidated
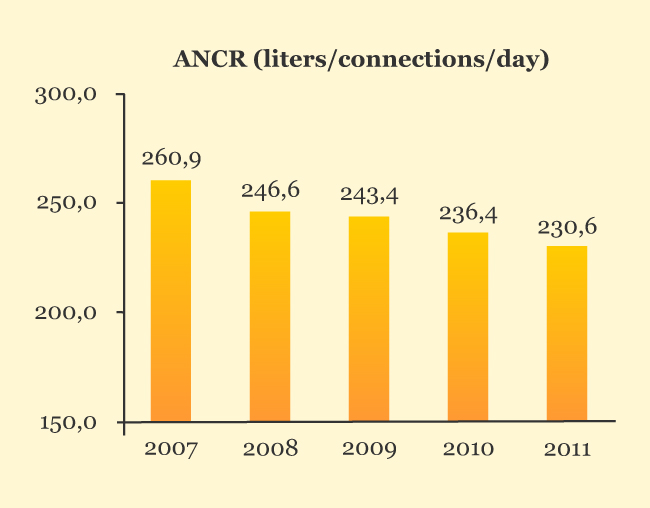
¹ Consolidated (COPASA + COPANOR) The Water not Converted into Revenue (ANCR) indicator, which represents the difference between distributed volume and the amount actually consumed by users, due largely to the actual water loss resulting from the rupture of pipes, theft and measurement inaccuracies, reached 230.6 l/connections/day in 2011, down from 236.4 l/connections/day in 2010. This indicator is one of the most used and most important in the industry, and the Company’s results are being used as reference by sanitation companies throughout the country.
Based on data accumulated since January 1998, the total delinquency rate – which corresponds to the ratio between the balance of accounts receivable and the total amount billed – improved in 2011, reaching 1.29% and is considered one of the best in the country and a reference for the other companies operating in the sector.
The Company’s delinquency rates have been declining steadily in recent years as a result of a consistent commercial policy, which includes the development of effective collection actions, and policy of negotiating debts with large customers and public administration organizations.
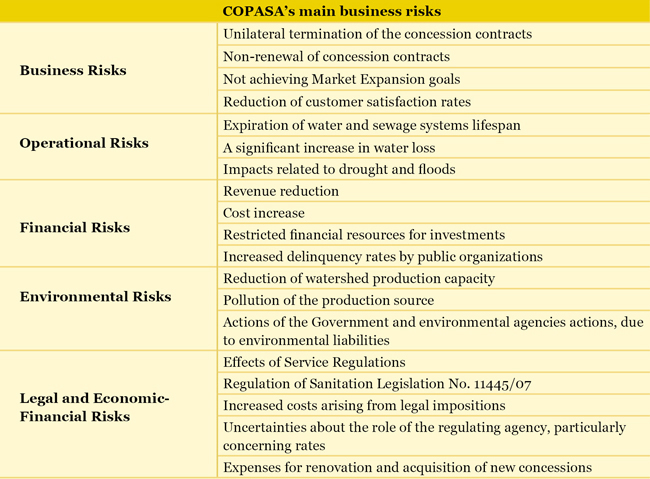
KEY RISKS AND OPPORTUNITIES The ability to identify risks and capitalize on opportunities is essential to ensure the company’s sustainability. In the process of developing the strategic plan, business risks that may affect the Company’s proper functioning and sustainable development are identified and analyzed. This identification allows the Company to take a proactive role with the goal of managing these risks.
COPASA has business contingency action, which foresee immediate actions to situations such as contamination of water supplies, floods, epidemics and outbreaks, drastic flow reduction of surface and groundwater, prolonged drought and chemical leakage, among others. Any occurrences are discussed in management meetings, where sufficient preventive actions are determined in order to prevent recurrence. This practice is connected to a methodology of communicating relevant events to the Executive Board called SOS COPASA, a crisis management program that enables proactive actions in searching for solutions to possible events which may affect the Company image. As for opportunities, the strengths listed below provide COPASA conditions to seek new opportunities to operate in the sector, decreasing business risks: Balanced financial situation In addition, all water supply and sanitation service revenues are supported by formal instruments of long-term concession contracts and program contracts. Scale and scope gains due to capillarity Perceived quality Low delinquency rate Availability of water resources granted above the current needs Technical expertise Excellence benchmark of in the sector
KEY STRATEGIES Practice a management model based in Strategic Planning, focusing on business sustainability Identify and evaluate new business opportunities in Brazil and abroad Establish strategies for operations in the solid waste market
Establish, promote and strengthen social responsibility Among the management tools used to monitor its social actions, COPASA performs a diagnosis of its social responsibility practices using the Ethos Social Responsibility Indicators. The Company answers the questionnaire and the results obtained through Diagnostic Report and issued by the Ethos Institute, is used to establish the internal strategic indicator, called Atuação com Responsabilidade Social [Performance with Social Responsibility] (ARES), referring to the strategic goal to “Perform with Social Responsibility”. Promoting Development, Welfare, Health, Safety and Employee Appreciation Contributing to Environmental Preservation
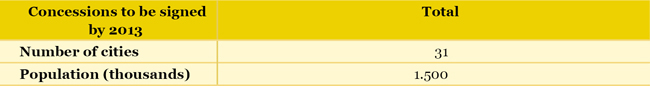
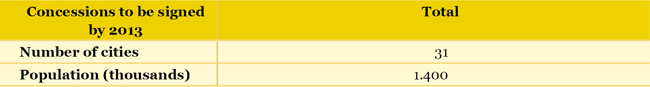
MAIN GOALS AND RESULTS In reviewing its Strategic Planning, COPASA found the need to redefine its market expansion in view of the new scenario established for the business environment, due mainly to Legislation 11445/07, and subsequently Decree 7217/10, which regulated and established national guidelines for sanitation, and changed the procedures for negotiating concessions, with the addition of new steps to the development process. The goals for expansion of concessions, broken down by priorities and with variable scope were redefined for the period 2010 to 2013 as follows: I- Expand sewer concessions where the Company already holds water concessions Initially, there were 51 cities with population exceeding 15 thousand. As of December 31st, 2010, 20 concessions have been granted. The remaining 31 concessions will be signed between January 2011 and 2013.
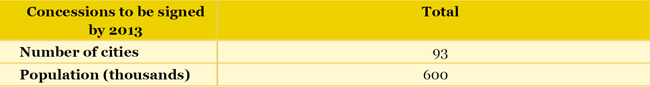
Of this group, four concessions were signed in 2011, totaling 390 thousand people. As for the others, two have already been authorized and 25 are under negotiation. Initially, there were 108 cities totaling a population below 15 thousand. Fifteen concessions have been signed until December 31st, 2010. The remaining 93 concessions will be signed between January 2011 and 2013.
Of this group, four concessions were signed in 2011, totaling 32 thousand people. As for the others, 32 have already been authorized and 66 are under negotiation. II- Expand sewer and water concessions Initially, there were 33 cities with population exceeding 15 thousand. As of December 31st, 2010, two concessions have been granted. The remaining 31 concessions will be signed between January 2011 and 2013, and all of them are under negotiation.
III – Establish a full rate collection related to sanitation in cities where there is a rate discount because sewage is not being treated. Regarding this goal, 187 locations were being billed for sewerage services on December 31st, 2011. The full sanitation rate was applied in 77 of those locations. Among the 110 locations where the full rate is no applied, 50 have treatment plants under construction, 4 are in the bidding phase, 12 are hold finished projects and 1 has project being developed and is awaiting the completion of the bidding process, for the construction of its plants. IV - Continuing several jobs which are part of the Company’s growth plan For 2012, COPASA intends to continue the important jobs which are part of its growth plan. The most important are:
|
||